
An independent company with 22 years of expertise in flight data animation for Flight Safety and Pilot Training
Flight safety
Big data for pilots: how to exploit all the potential of this source of information to make it a real game changer in pilots’ awareness and performance improvement
For this article of Captain Pierre Wannaz from the 3rd blog series "a pilot's view" placed under the general theme of digitalization in aviation, Pierre completed and renewed some aspects of his article about big data.
By Capt. Pierre Wannaz - Aug 27, 2019
#BigData #FlightData #PilotTraining #Performance #Skills #Digitalization
In aviation, terabytes of information are stored daily. They are used for some specific tasks like predictive engine monitoring or flight safety index, but they are massively underexploited in order to improve pilots’ flight performance at an individual level!
“Big data is like teenage sex: everyone talks about it, nobody really knows how to do it, everyone thinks everyone else is doing it, so everyone claims they are doing it…”
Dan Ariely, Duke University
Big data is like teenage sex: everyone talks about it, nobody really knows how to do it, everyone thinks everyone… http://t.co/tREI1mRQ
— Dan Ariely (@danariely) January 6, 2013
Big data brought to an individual level: what for?
Today, big data is on everyone’s lips. At a management level, I can figure out that it is important. But what can a pilot learn out of it?
With today’s approach, pilots can do almost nothing with this data…
Sometimes, pilots receive some obscure statistics like the “Safety Index” or the “Fleet performance”. For a regular line pilot, this information is almost useless at an individual level.
Pilots also have the possibility to ask their Flight Safety Department for specific flight data (like an approach for example). But what they get is a matrix of numbers and some obscure graphs that are difficult to understand. Most pilots have not been educated as engineers or mathematicians!
On the other hand, I am convinced that using a part of this big data is important and can be a game-changer in the way pilots can improve their performances on a practical basis.
Short landing or not: a concrete example of how data is not sufficient in itself
Let’s take an example: For most airlines, the touchdown zone is defined between 300 and 600 meters after the runway threshold. One landing will be flagged as too short because it is just beyond the event threshold, whereas another one will be considered as good because it lies within the acceptable values. But where are the real differences between these two landings?
Can such a threshold categorize accurately pilots’ performances? I express doubts about it. Unfortunately, if only raw figures are delivered by the system, as in today’s standards, it is impossible to figure out how the landing was performed.
In the example above, the system might flag a pilot that had an overall good performance, a well-stabilized approach with a constant aiming point, but who just missed the ideal flare point, resulting in a landing a little bit short and out of the intended landing zone. The second pilot might have had a bad practice, fighting with the elements, having an unstable aiming point, but landed within the landing zone by chance and he will be ignored by the system.
The second pilot definitely needs more drastic corrections in his landing technique than the first one. Looking only at statistical values and pinpointing performance values is merely a small and misleading part of the reality of performance.
How to improve this current situation? An animation tool can use a part of the data recorded by the flight recorder to give a few minutes after landing a video representation of the relevant parts of the flight. I am convinced that such a tool can deliver much more valuable and interesting information.
WE DO NOT UNDERSTAND A SINGLE VALUE BY ITSELF, WHAT WE UNDERSTAND IS A WHOLE PROCESS!
How can flight animation help with this data presentation issue?
Now imagine the potential gain in situational awareness, if pilots had a dynamic representation in form of animation – so if an airline safety department could provide pilots with a set of usable big data, additionally to this recorded data in form of graphs and figures.
In such a case, pilots, besides a better understanding of their own flight performances, would have the opportunity to realize the achieved performance by themselves: By discussing with their instructor as far as trainees are concerned, or with a trustworthy person if help is needed to better understand.
Besides the understanding of the process leading to a result, pilots would also be in a position to see how they perform (personal data) in comparison with the rest of their fleet (out of big data). This way, they would be able to see how they performed toward the overall fleet’s performance and how far they are from the limits.
Today, as far as pilots are not exceeding the limits set by the flight data monitoring department and the safety officer, they just have a subjective and unprecise idea of the quality of their own performance compared to other pilots in the fleet.
Assessing your own performances by yourself to improve your skills: a case study of the take-off rotation rates
Let’s have a look at another concrete example: the take-off rotation rate.
On some fleets, especially four engines airplanes, this performance aspect is a crucial one. A too fast rotation might indeed lead to a tail strike, whereas a too slow rotation might lead to losing valuable runway distance, low screen height at the end of the runway which results in a climb-out trajectory, well below the path calculated by the performance computer. This can massively reduce the safety margin and it is not safe!
If big data was provided by the flight safety department, it would be possible to implement a static graph showing the actual flown values within the overhaul fleet performance.
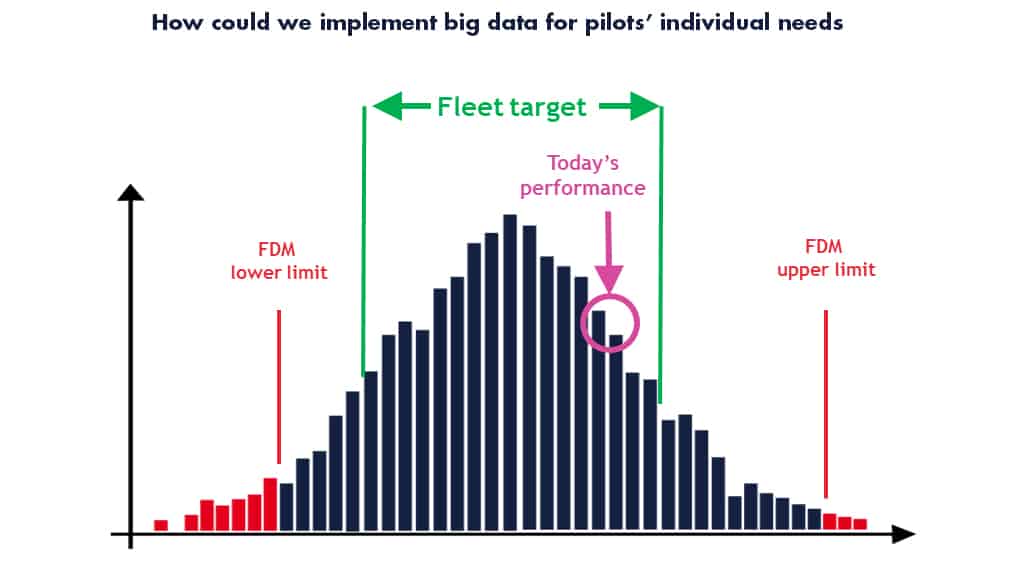
On such a graph (see above), the repartition of the rotation rate for the whole fleet of an aircraft type at a specific airport is displayed. Other ranges such as the limits that will trigger a flight safety event (red) and an area representing the fleet target (green, as defined by the chief flight instructor or the chief pilot) can be displayed.
The magenta down-pointing arrow is the achieved value from one’s own analyzed flight.
Being able to use big data with such a representation will allow pilots to fine-tune their performances and own flying skills when they realize that they are operating very close to the published boundaries. This way, with small corrections, they are able to improve their safety margin.
THIS TYPE OF INFORMATION WILL ALLOW A FINE-TUNING OF OWN PERFORMANCES
With these big data figures and an animation of the process that leads to the value, pilots will be in a position to make small corrections or adjust their performances, allowing an overall performance that is more efficient and homogeneous.
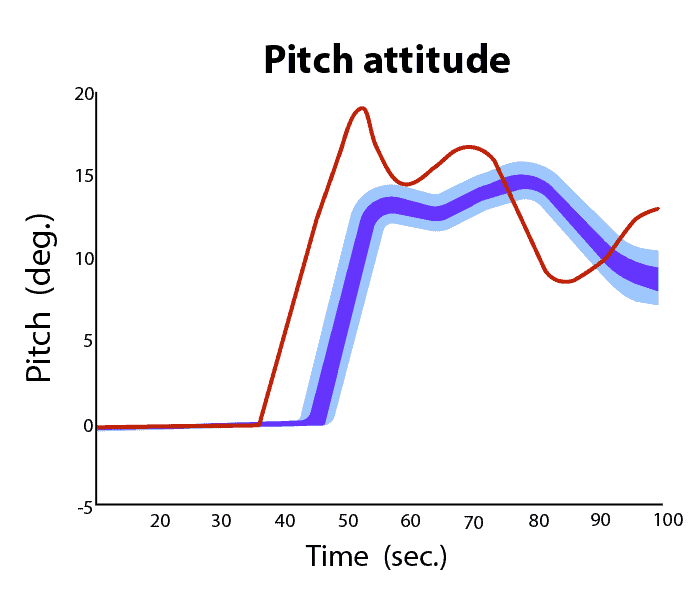
Airlines also have the possibility to add much more detailed information for sensible safety issues. In the take-off rotation rate problem mentioned above, a graph showing a specific pilot’s behavior – here the stick input – can be added:
Many possibilities exist, here are just a few that could be implemented:
- landing distance,
- touch down distance,
- runway line up distance,
- application of braking,
- screen height,
- etc.
Using tailored big data in such a way can be very useful for pilots and, finally, will be a game-changer to improve daily operations and to ensure the safety of the flights.
Let’s combine the statistical approach with an animated approach: This can be a great performance enhancement tool, allowing safer flight operations. Pilots will be more involved in improving their flight performances if they know and understand the reasons.
TODAY WE DO HAVE A TOOL ALLOWING THIS!
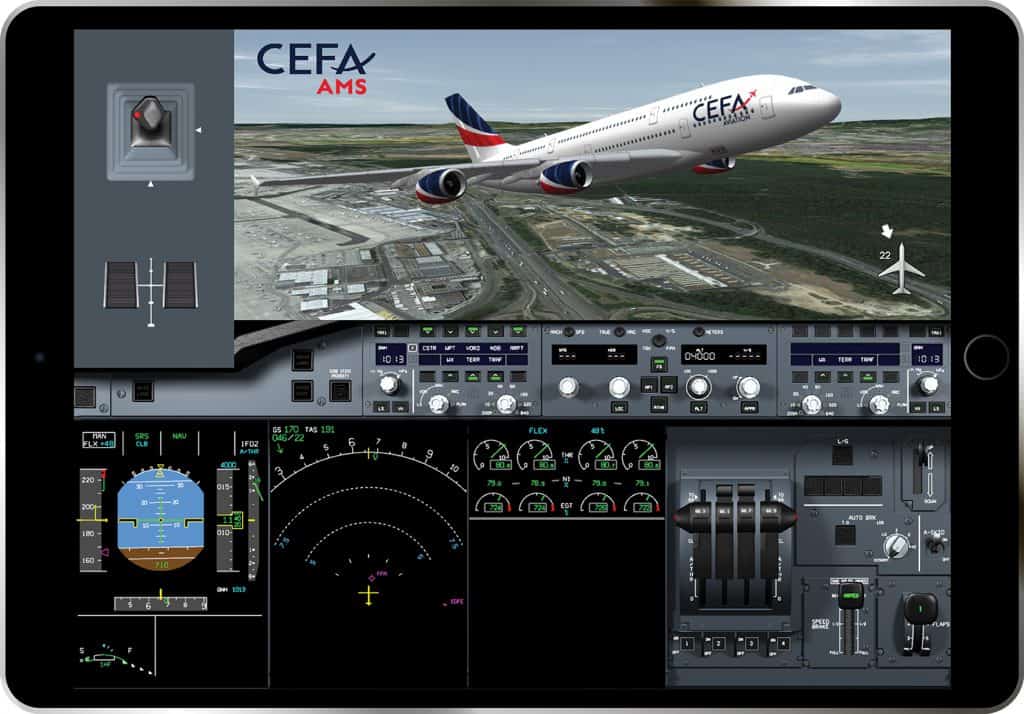
CEFA Aviation proposes a system called CEFA AMS (Aviation Mobile Services). This service allows each pilot to get a real-world 3D animation of her/his performance a few minutes after landing. On airline demand, some statistics can also be implemented as described above.
Tablets, connectivity, wireless QAR: All these tools, combined with the right software, allow access to data that was not available for pilots until now. This will change their attitude toward flight data, as they are presented in an easily understandable way.
THIS IS AN EASY WAY TO ENHANCE PILOTS’ AWARENESS AND IMPROVE FLIGHT SAFETY
USING BIG DATA IN A PRACTICAL FORM!

Pierre Wannaz
Senior Advisor CEFA Aviation
Captain on A330/A340, TRI/SFE, acceptance pilot and legal expert in accident investigation
Now, what do YOU think about using big data to improve pilots’ performances at the individual level? Share your personal thoughts in the comments below!
You can also come & discuss with me personally on CEFA Aviation stand, booth #404, during the 16th Asia Pacific Airline Training Summit (APATS) 2019, organized by Halldale in Singapore from 3rd to 4th September 2019. You can also contact me via LinkedIn or via this link. Talk to you soon!
Next to be read: keep your eyes peeled next Tuesday, 3rd September 2019 with an article about the Electronic Flight Bag!
To get a demo of this new tool, contact CEFA Aviation on the web or per email
You can find all my other articles in my blog “a pilot’s view” here.


Flight safety and pilots’ line training tools: a new winning team!
Single-pilot aircraft: Is there a pilot onboard?